4.3 Configure the Dashboard
Overview
Amanda and her team would like to be able to quickly visualize cases by priority.
In this exercise, you will open the Workspace Experience and configure the main dashboard to help them do this.
Instructions
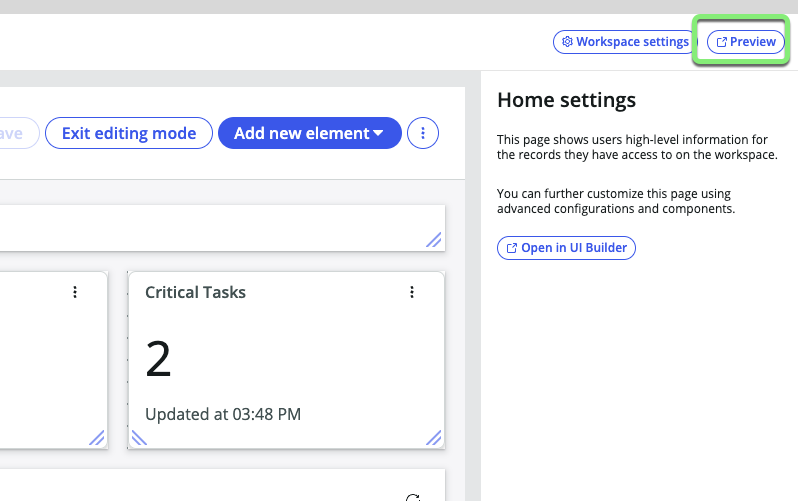
- Click the Preview button in the upper right to open the workspace in a new browser tab.
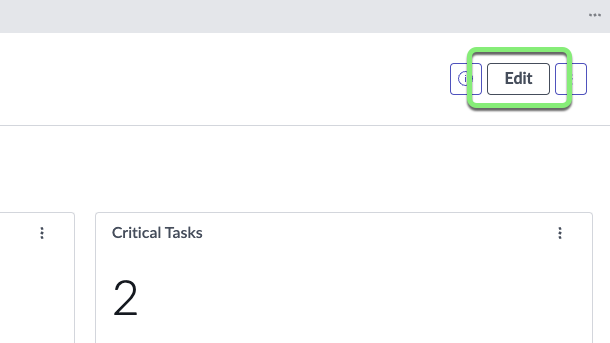
- Go into Edit Mode by clicking the Edit button
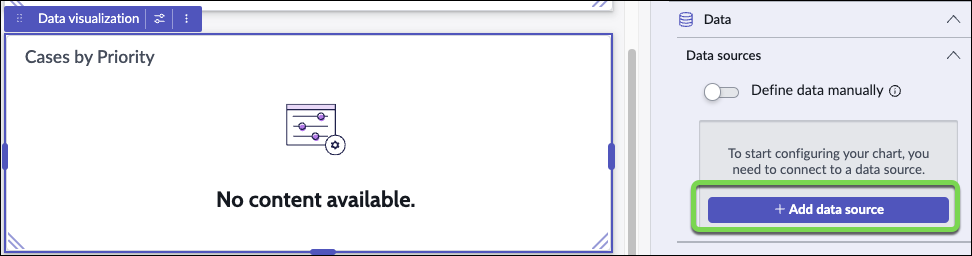
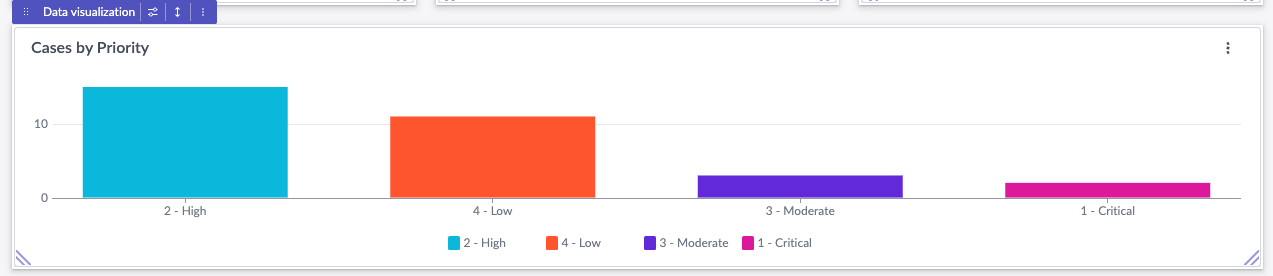
Add a new Data Visualization of a Vertical Bar chart showing Telework Cases by Priority.
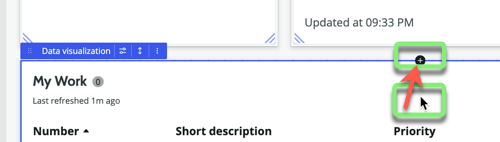
- Click the My Work data visualization.
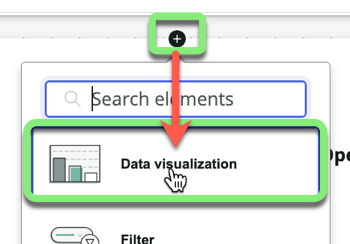
- Click the black plus icon at the top center of the My Work data visualization.
- Click Data Visualization.
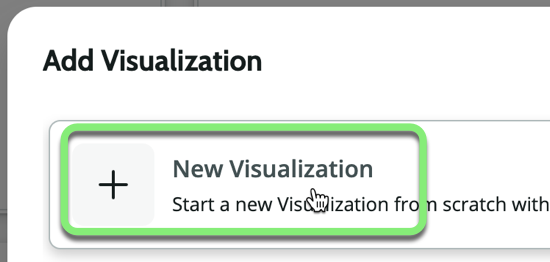
- Click New Visualization.
- Click the bottom-right corner of the new Visualization and drag it across the page.
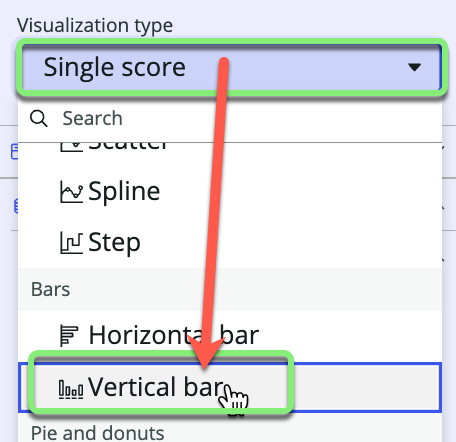
- Configure the Visualization type.
- Click the Visualization type dropdown.
- Scroll down and click on Vertical bar.
- Set the Chart title.
- Click on Header and border to expand that section.
- Type
Cases by Priorityin the Chart Title field.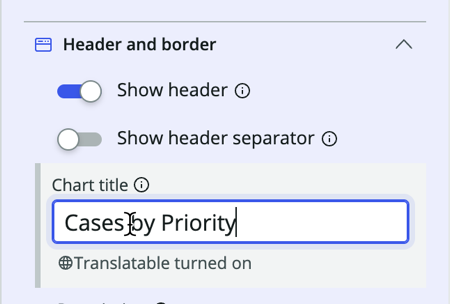
Add a data source.
- In the Data >> Data sources section, click .
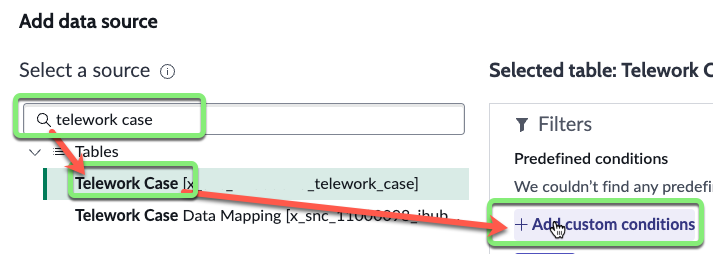
- Type Telework Case in the "Select a source" field.
- Click Telework Case in the search results.
- Click + Add custom conditions.
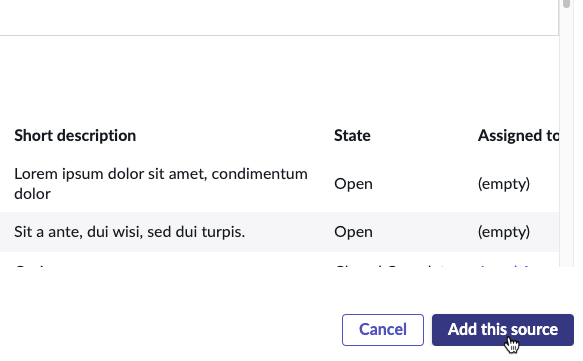
Amanda's team wants to see only the non-closed cases.
- Set State is one of Pending, Open, Work in Progress.

- Click in the bottom right.
- In the Data >> Data sources section, click .
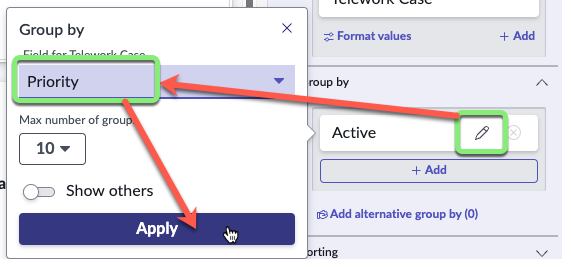
- Set the data visualization grouping.
- In the Data >> Group by section,
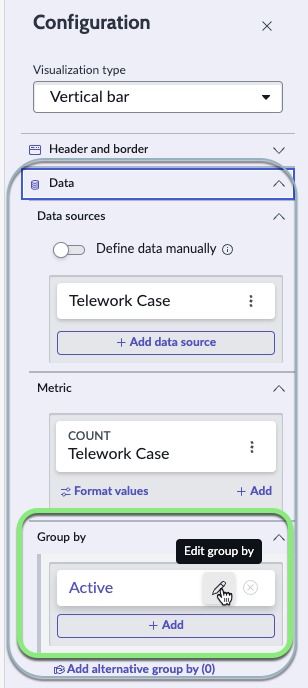
- Click the pencil icon next to Active.
- Set Priority for the Group by.
- Click Apply.
RESULT
- In the Data >> Group by section,
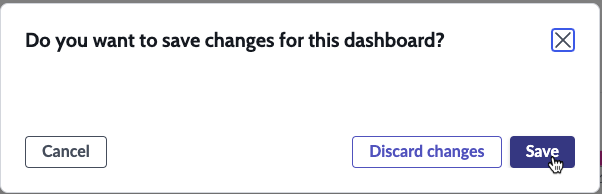
- Save the changes to the dashboard.
- On the top right, click .

- Click .
- On the top right, click .
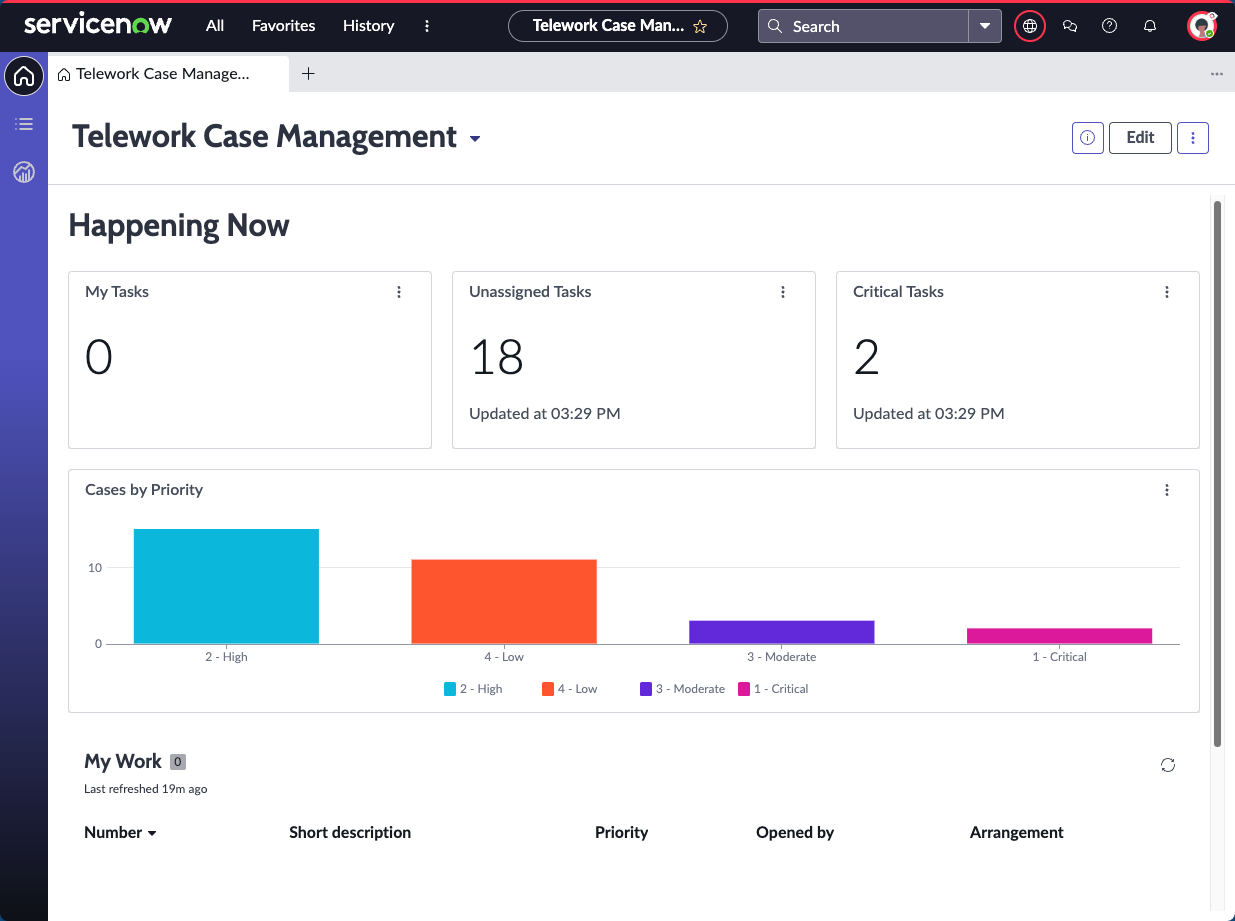
Your workspace should look like the image below.
Exercise Recap
In this exercise, we learned how to create a custom workspace and used the the Workspace Builder to display key performance indicators and organize information in ways that benefit our users.
For more information see Product Documentation: Dashboards in configurable workspaces