Bonus Exercise 2.2: Create a Dashboard
Let's create a dashboard so that users can have an easy view to understand current requests. Then, we will add three widgets to the dashboard.
Widget 1: All travel requests
- Click on the Home icon on the left sidebar to return to the workspace home page
- On the top right, click Edit
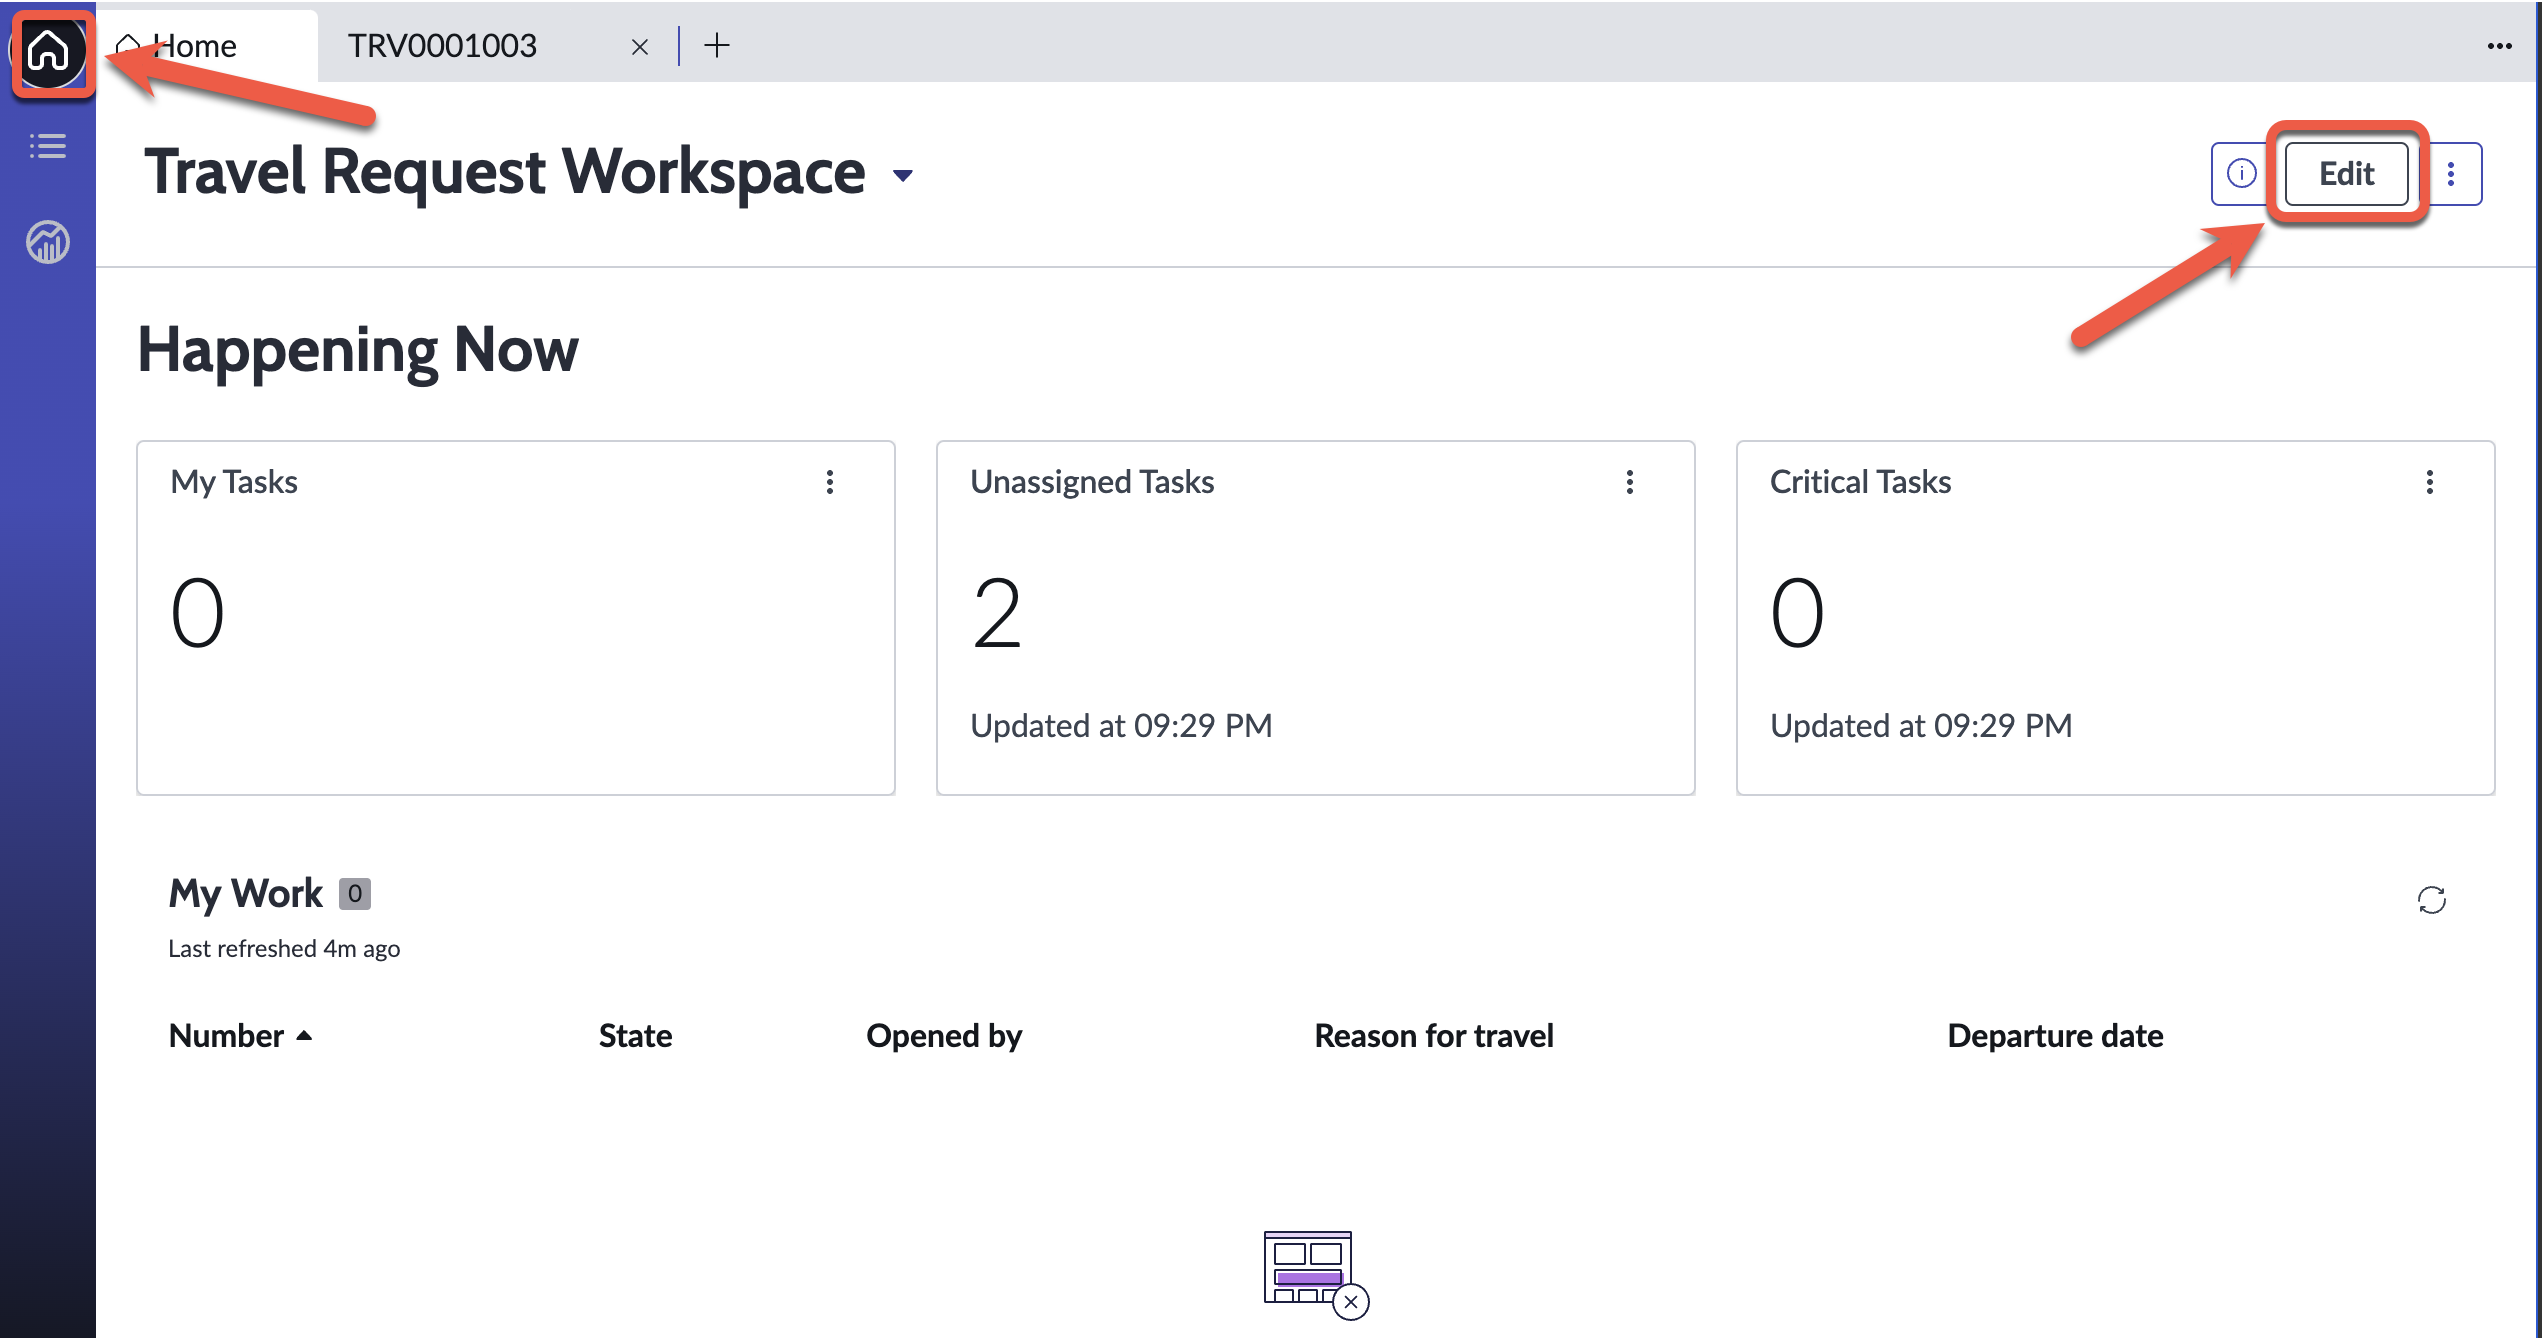
- Click My Tasks, then the Configure button on the highlighted Data visualization
- The right sidebar appears showing the Vizualization type Single score
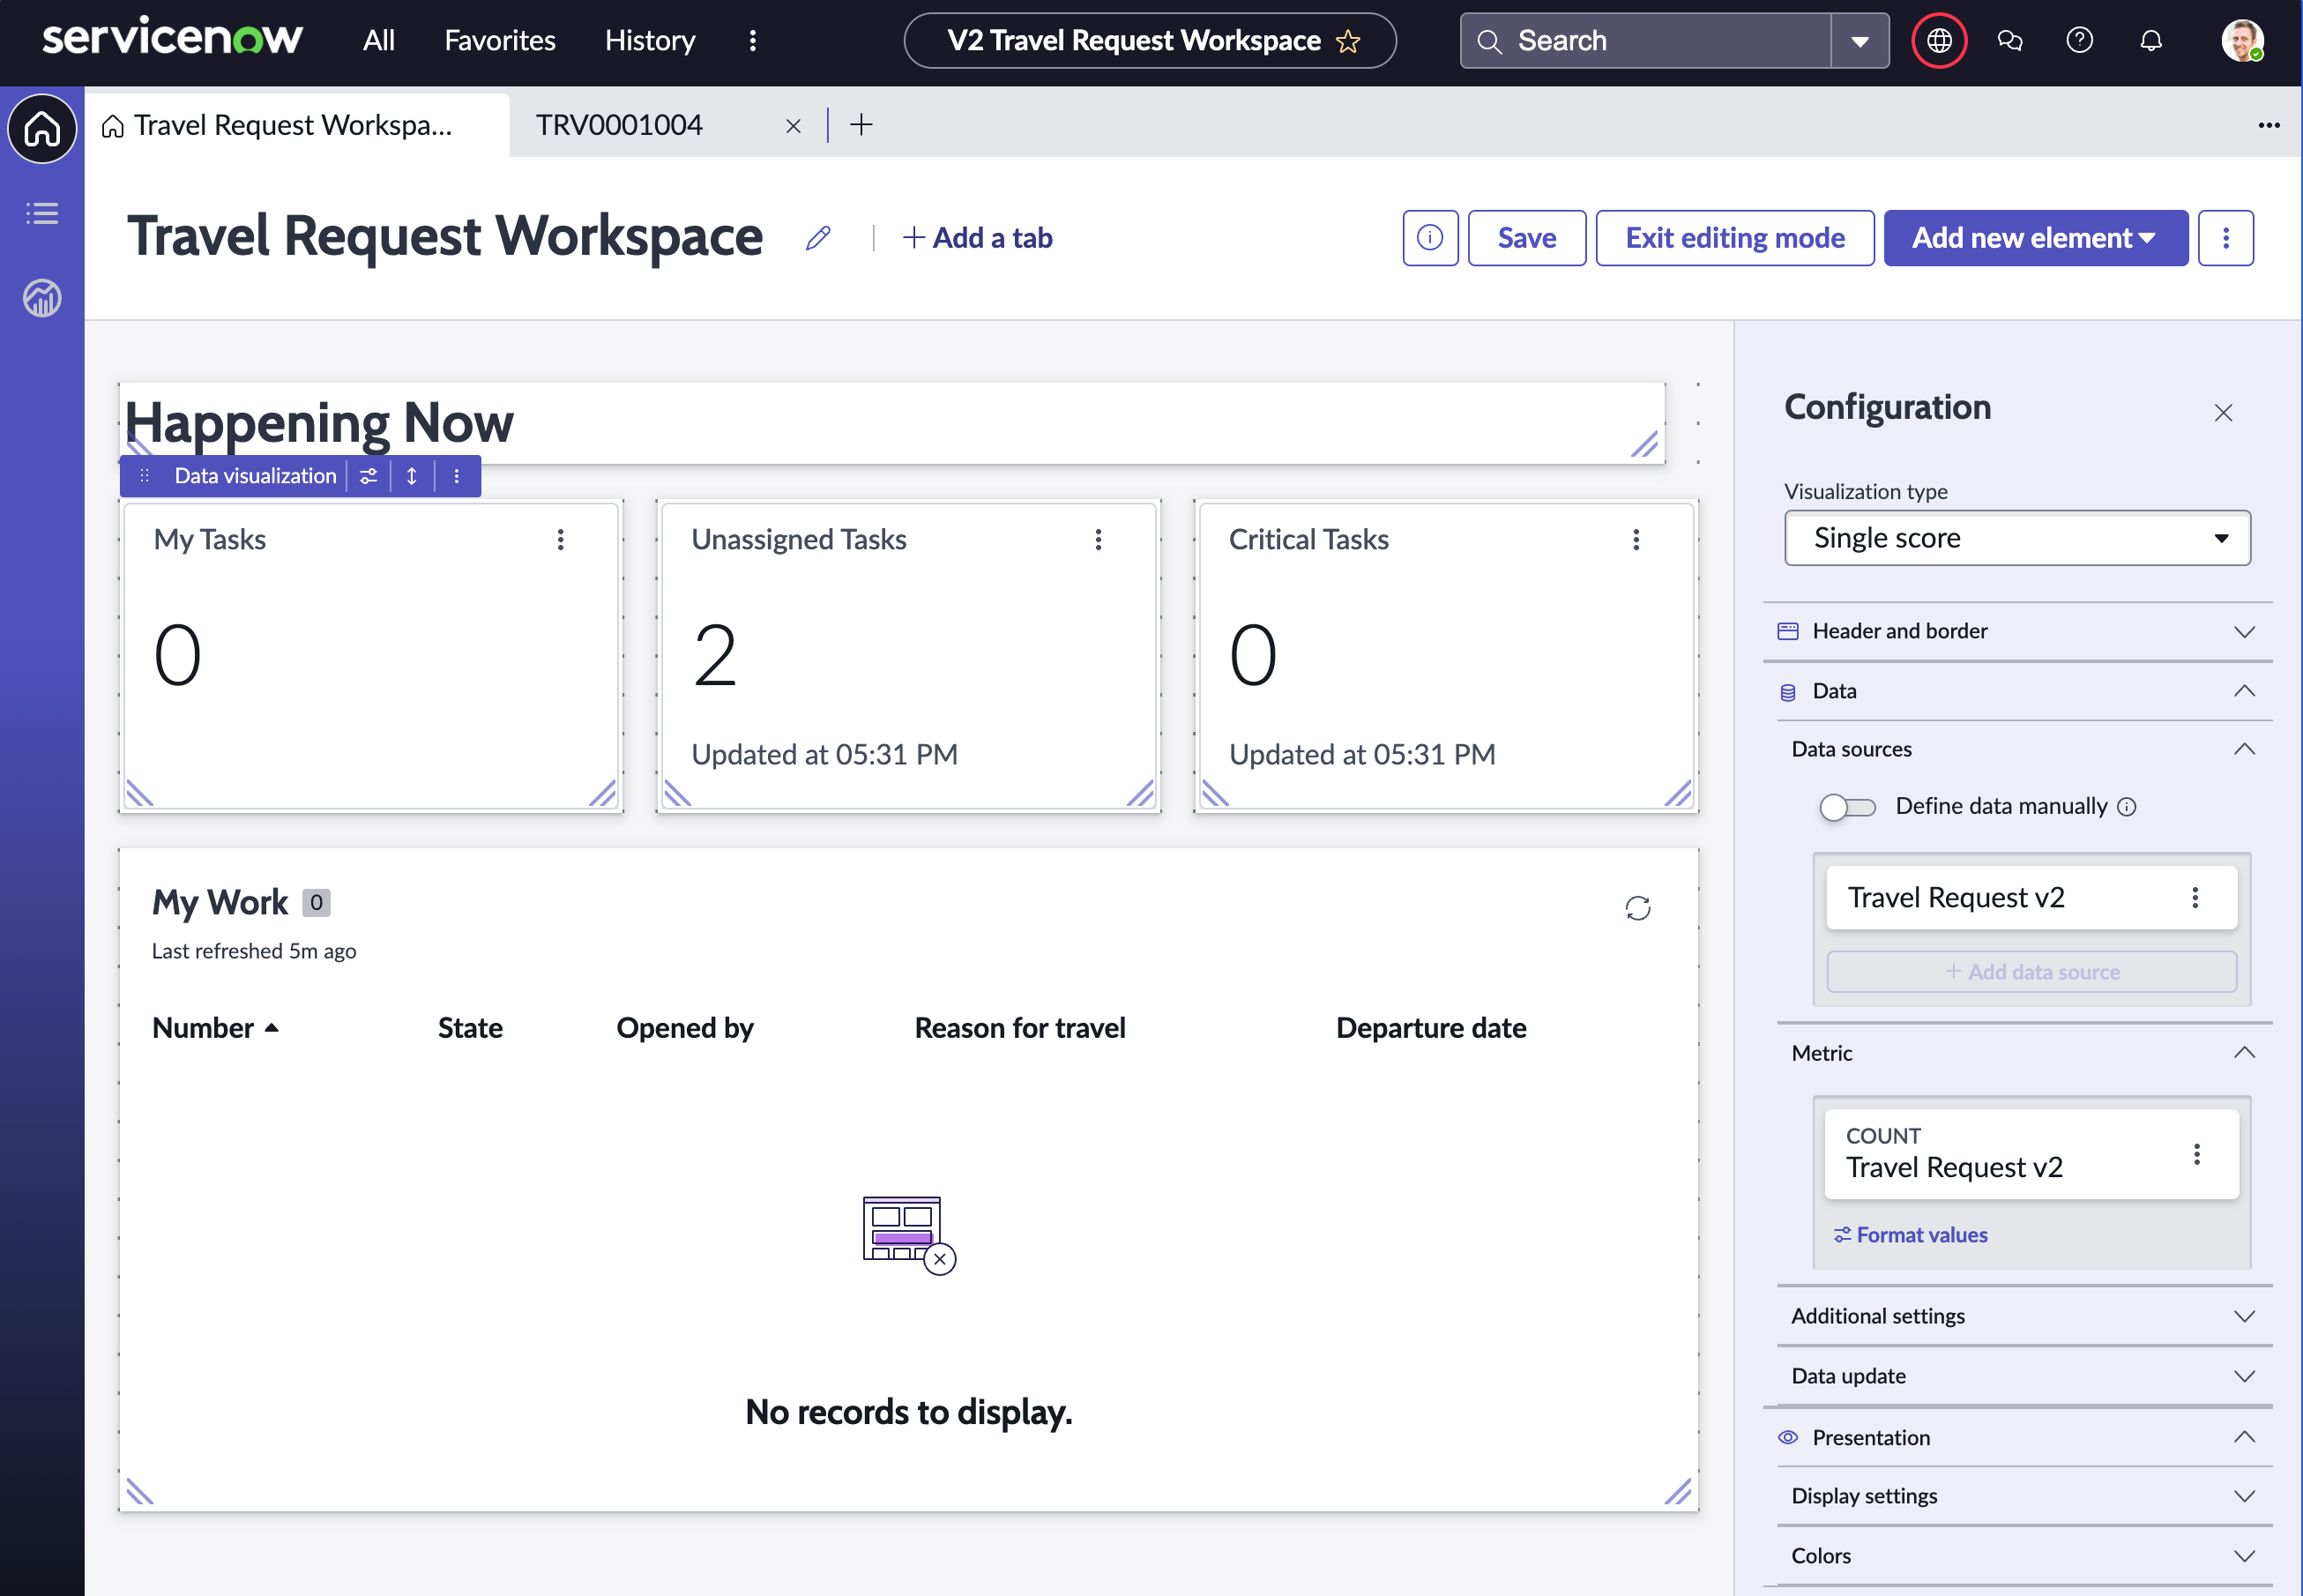
If you face issues with the screen not loading, change to a different Vizualization type, then change it back to Single score
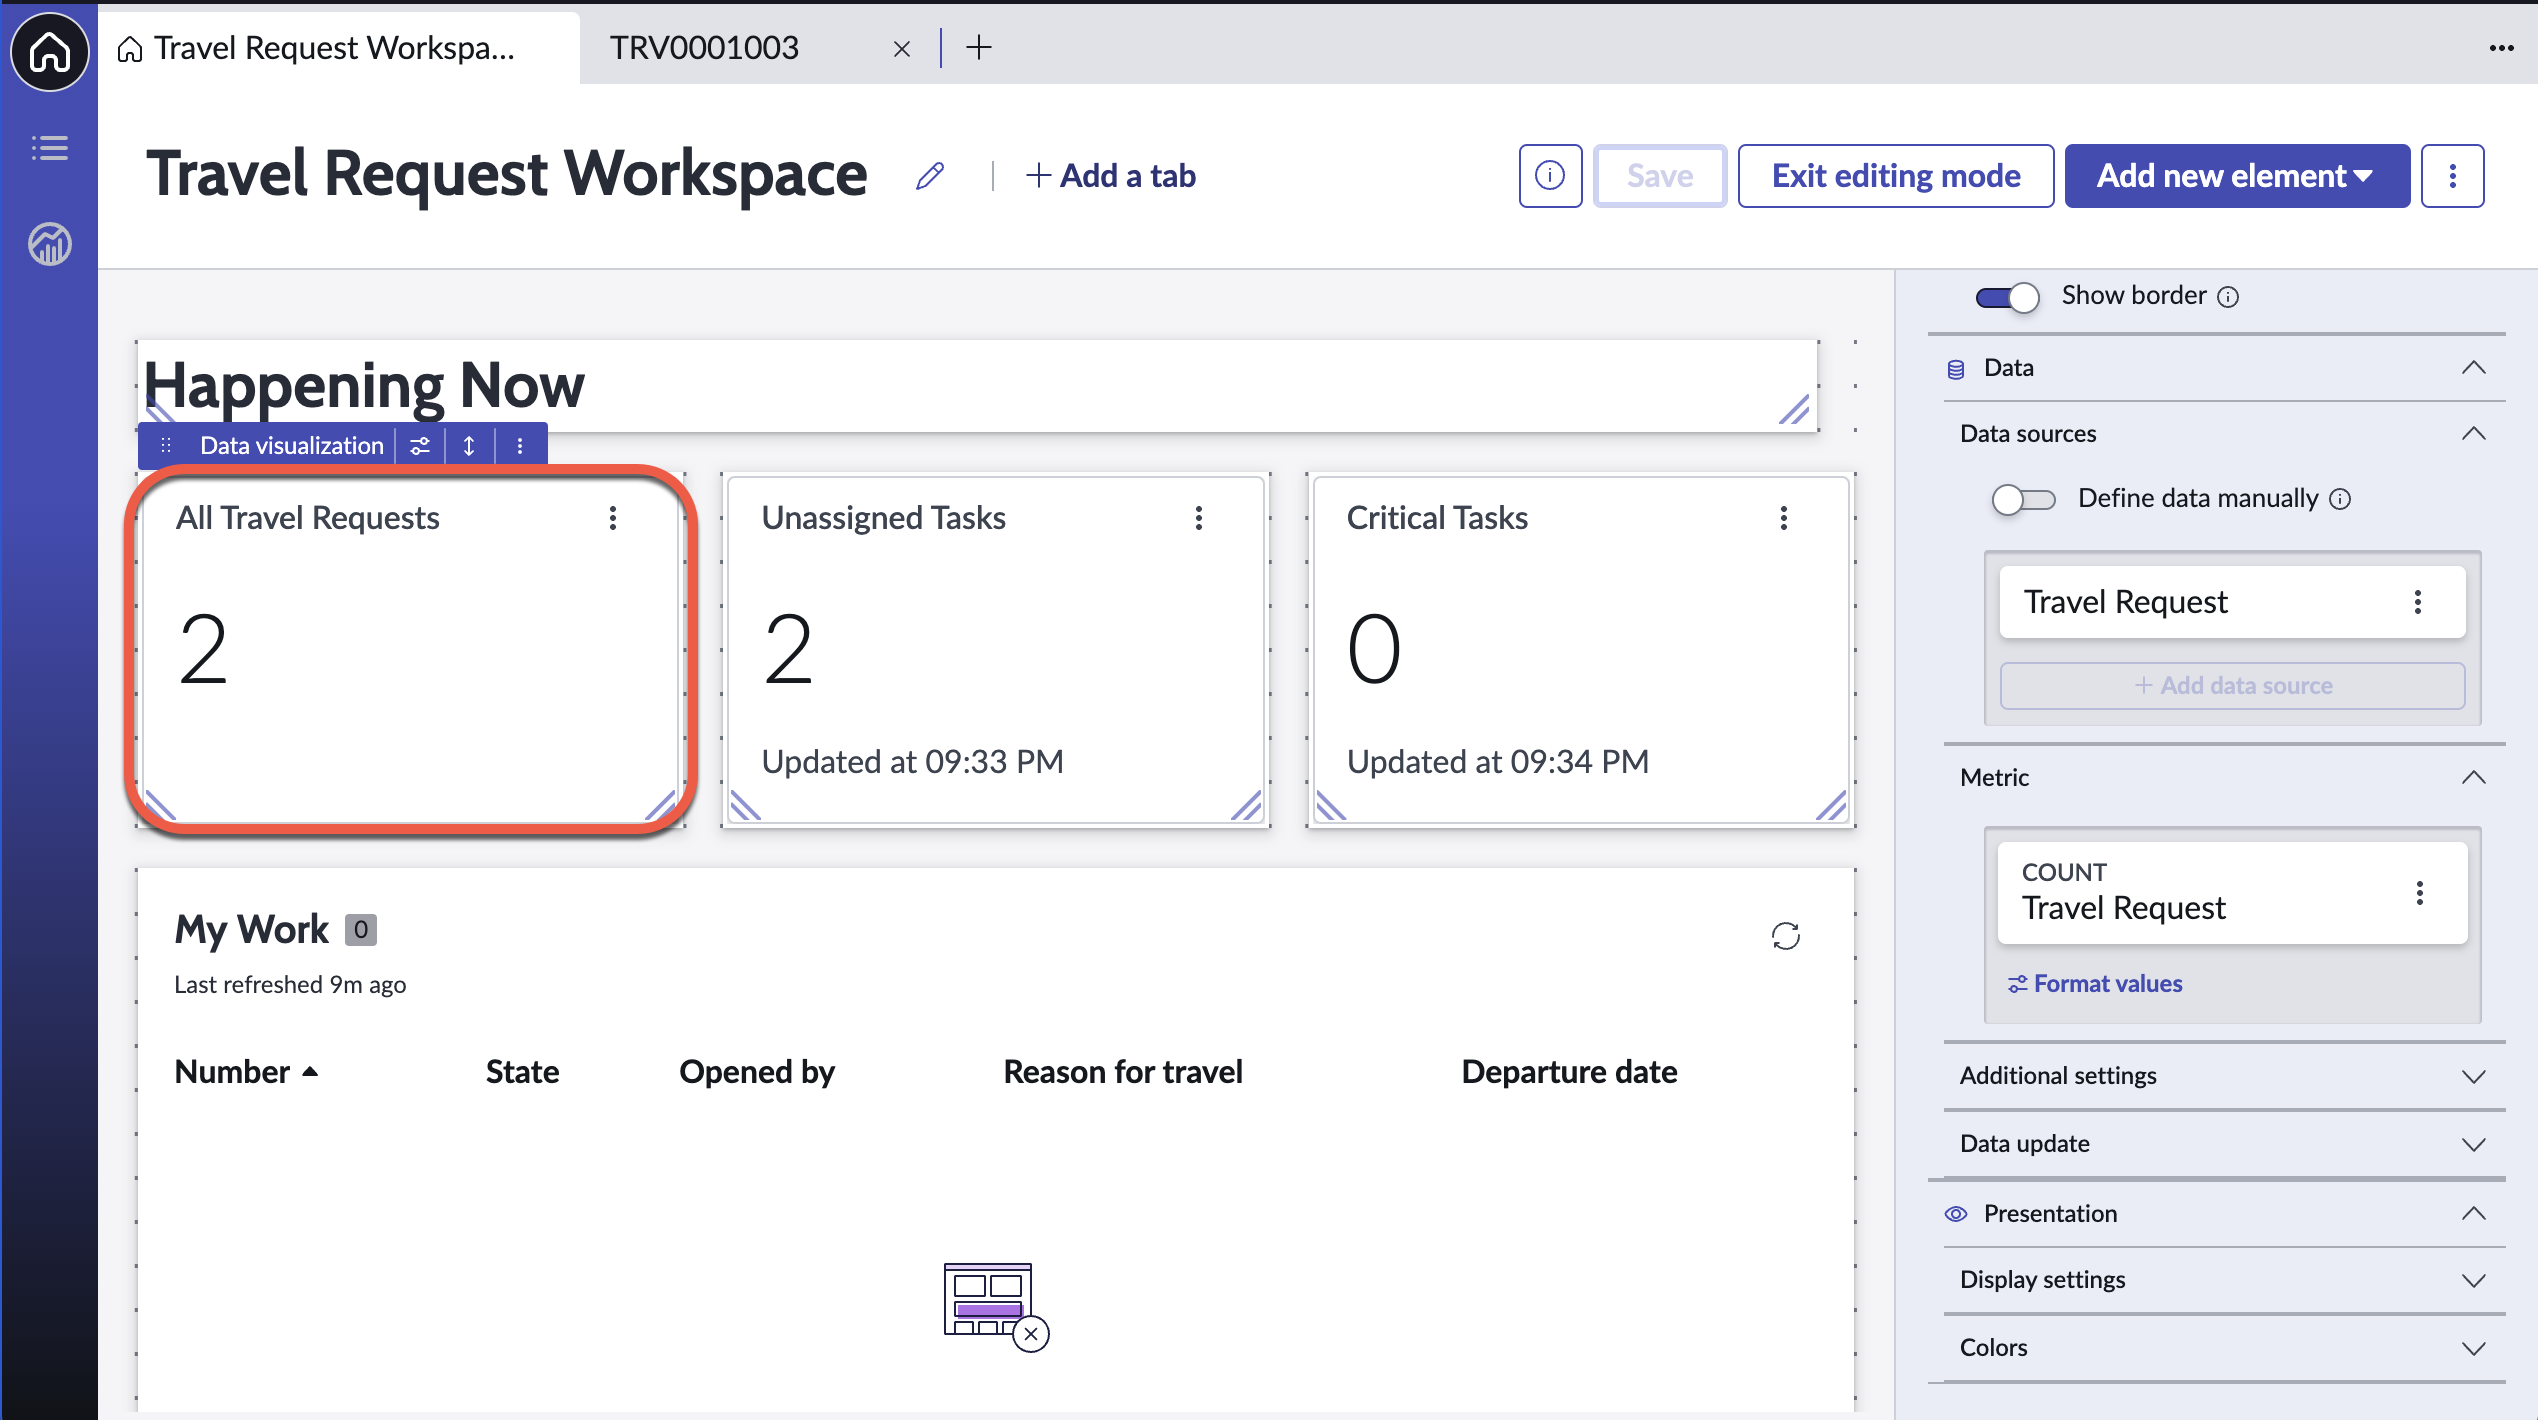
- Expand Header and border, then change Chart title to All Travel Requests. Here are all the steps so far:
- Under the Data sources section, click the 3 dot icon next to Travel request, then click Edit
- On the Edit data source screen, click Edit under Filters
- Remove the Assigned to condition by clicking the X icon
- Click Apply
- Confirm that the All Travel Requests widget now refreshes to show the number of Travel requests that you have created
- Click Save on the top right
Widget 2: Estimated travel spend vs budget
This widget can only be configured if you completed Bonus Exercise 1.
If you have not completed that, please skip this widget.
- Click and configure the next widget, Unassigned Tasks
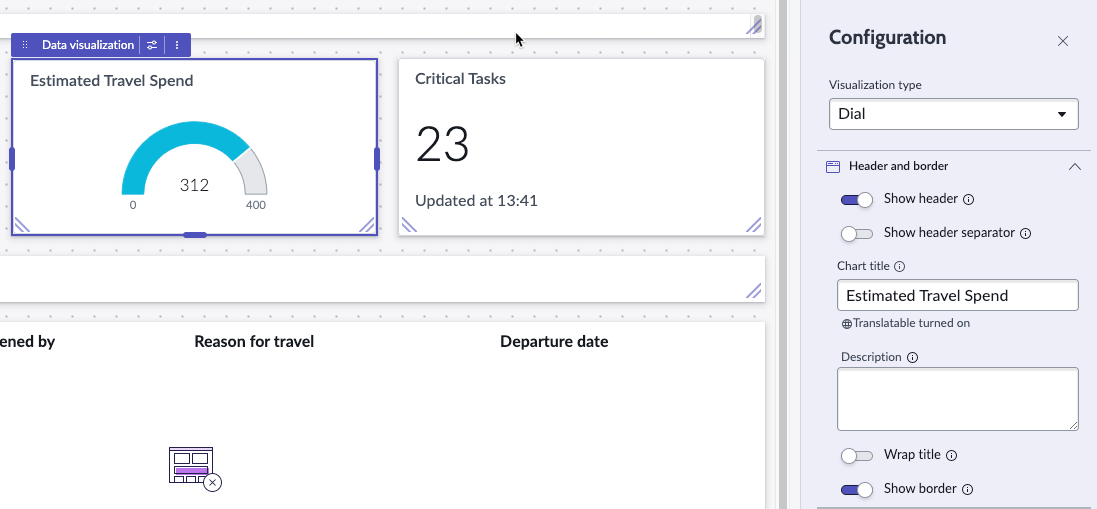
- Change the Visualization type to Dial
- Under Header and border change Chart title to Estimated Travel Spend
- Under Data sources, edit the Travel Request data source
- On the next Edit data source screen, click on Travel request [x_snc_travel_req_0_travel_request] under Suggested on the left sidebar
- Click Edit under filters, and remove the two conditions by clicking the x.
- Set the following condition:
OpenedonMonths -> This monthand click Apply.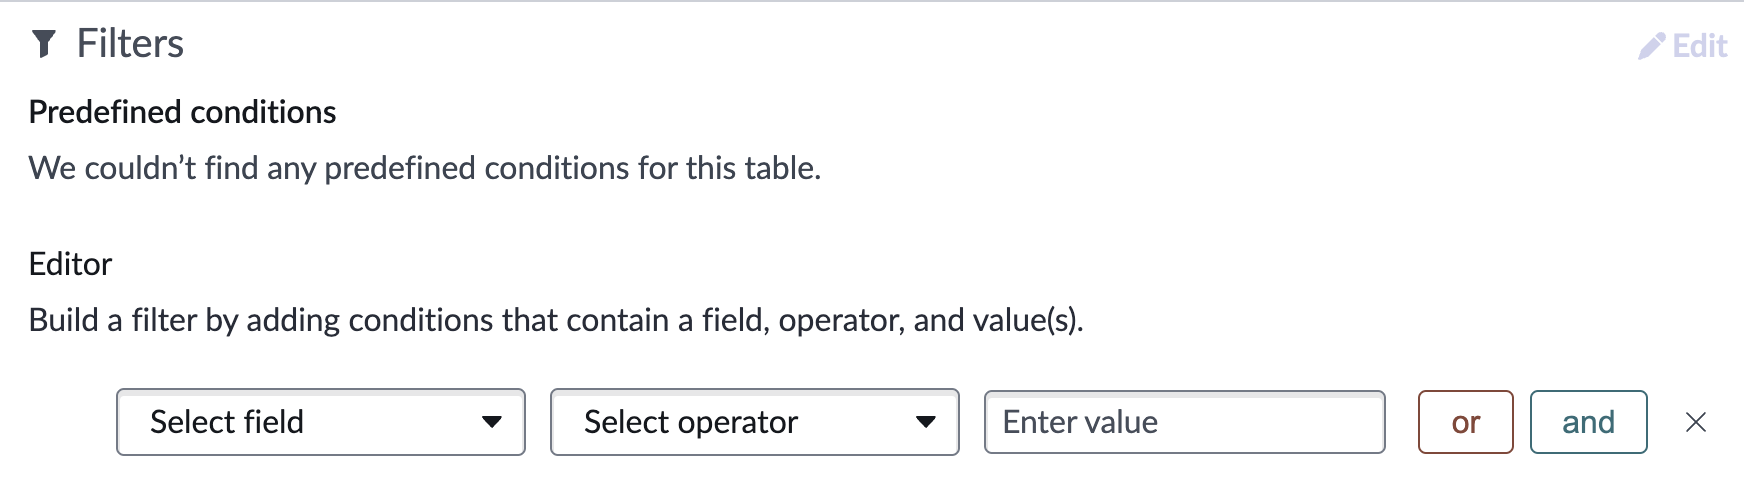
- Back on the Edit dashboard view, on the right sidebar, under the Metric section, click the 3 dot icon, then Edit for Travel request
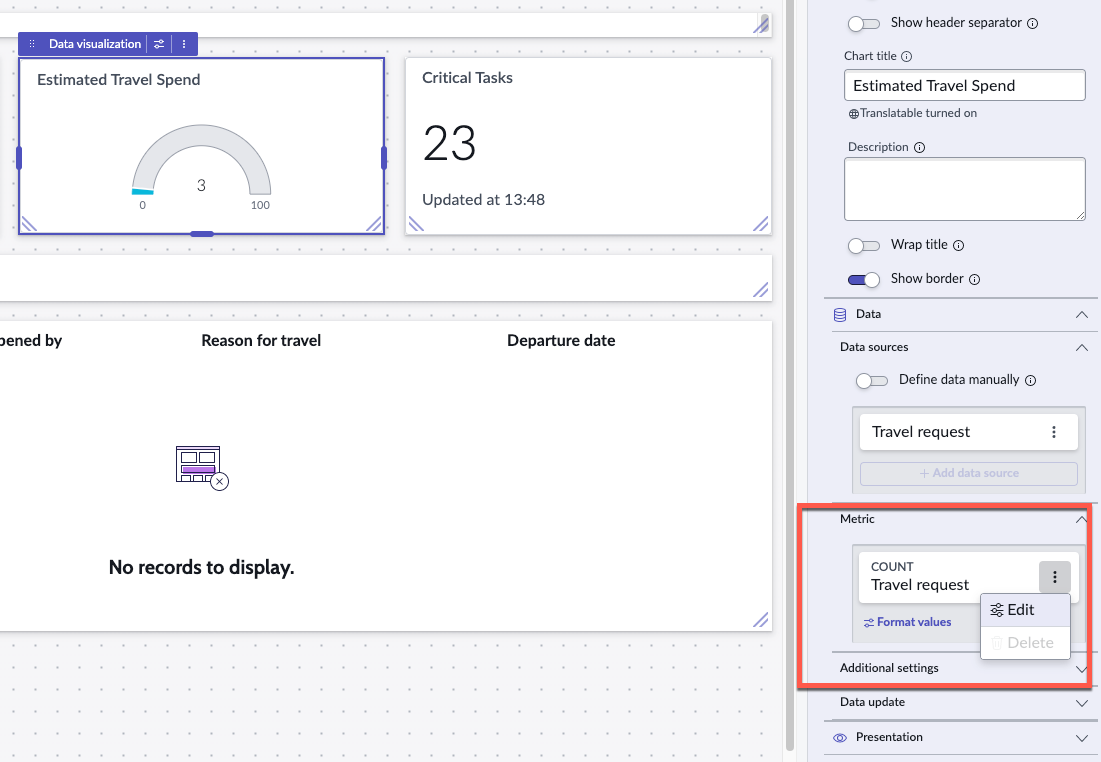
- On the pop-up box, change Count under Select an aggregation to Sum
- Change Field to Estimated trip cost

- Click Apply
- Click Format values under the Estimated trip cost metric
- In the pop-up box, toggle Use custom formatting
- Change Rounding to Up
- Toggle Enable abbreviation
- Click Save
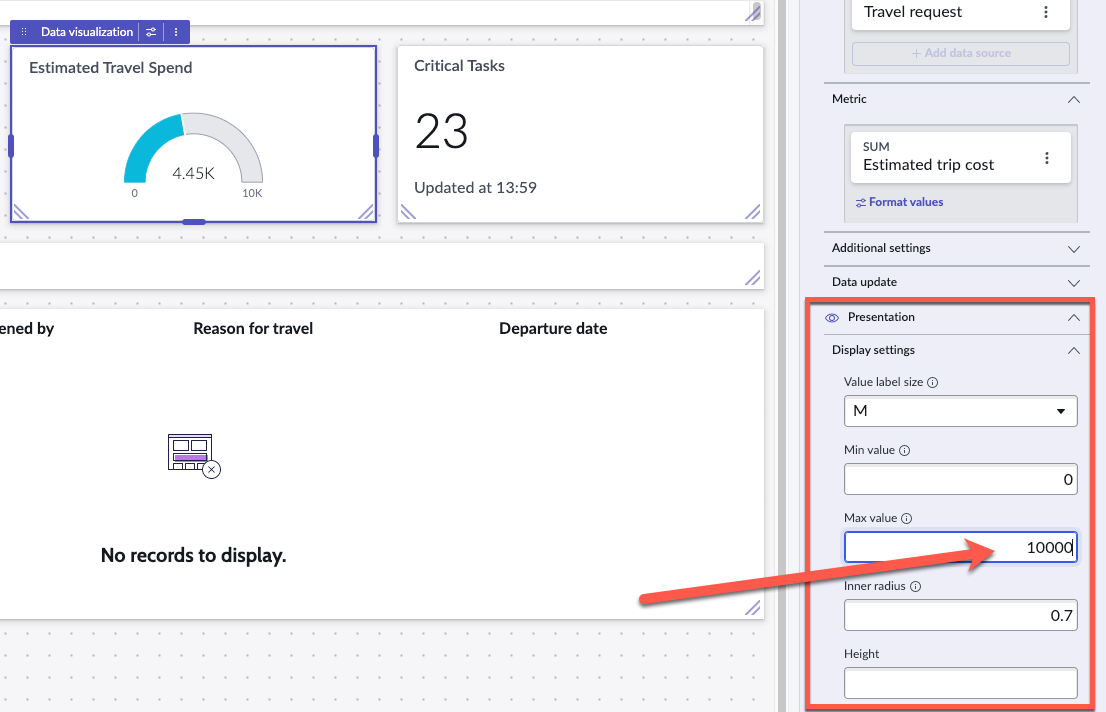
- On the right Configuration sidebar, expand Presentation, then expand Display settings
- Change Max value to a budget you think fits your current Estimated Travel Spend. e.g. here the Estimated Travel Spend is currently 4.45K for the month, so we will put the Max value at 10K
- On the top right, click Save
- Your middle Estimated Travel Spend widget should have been dynamically updating based on all the changes that we have been making
Widget 3: Outstanding Approvals
This widget will appear different if you have not completed Bonus Exercise 1, but will not impact completing the widget.
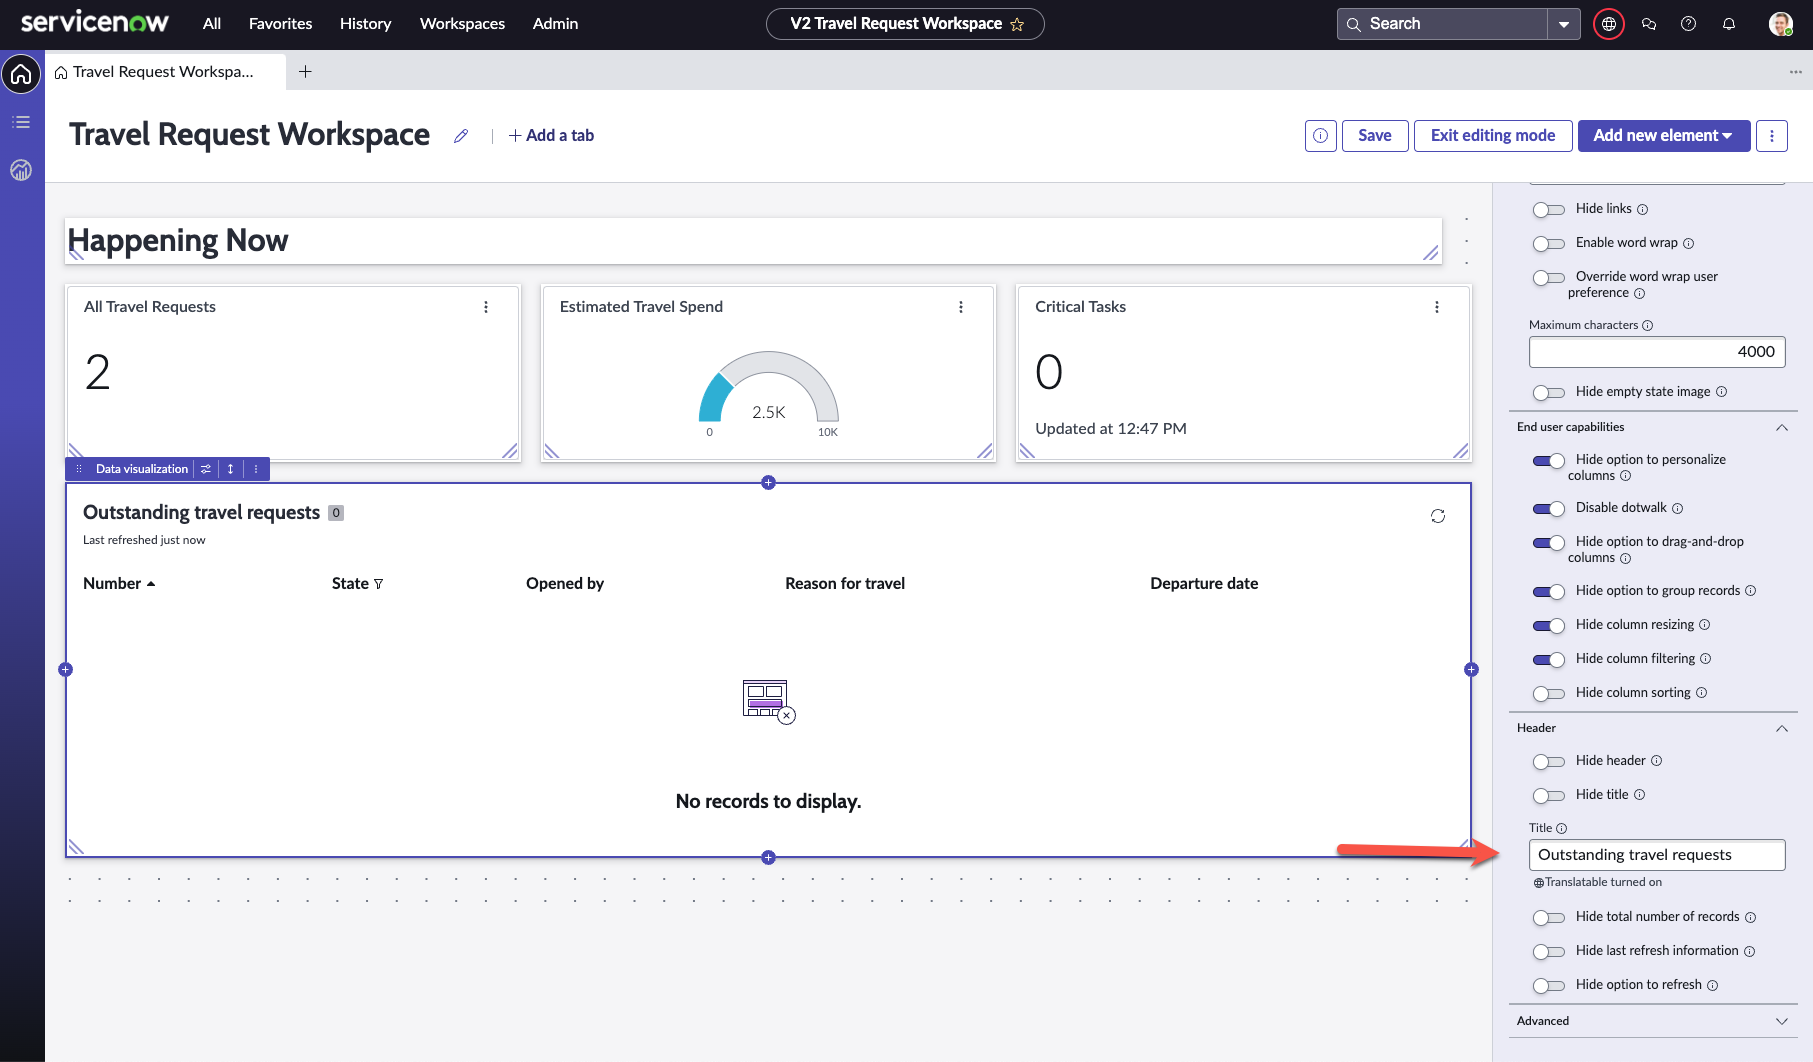
- Click the My Work list at the bottom of the dashboard.
- On the right configuration sidebar, scroll to the bottom of the configuration panel to the Header section. Change Label from My Work to Outstanding travel requests
- On the right configuration sidebar, scroll up and click Edit filter
- On the pop-up box, remove Assigned to is (dynamic) Me by clicking X on the far right of the row
- Click the and button
In the new and row that appears, set the following condition:
State is one of Pending, Open, Work in Progress
Refer to the video below:
- Click Apply, then on the top right of the screen, click Save
- Click Exit editing mode
- Your dashboard should look similar to this
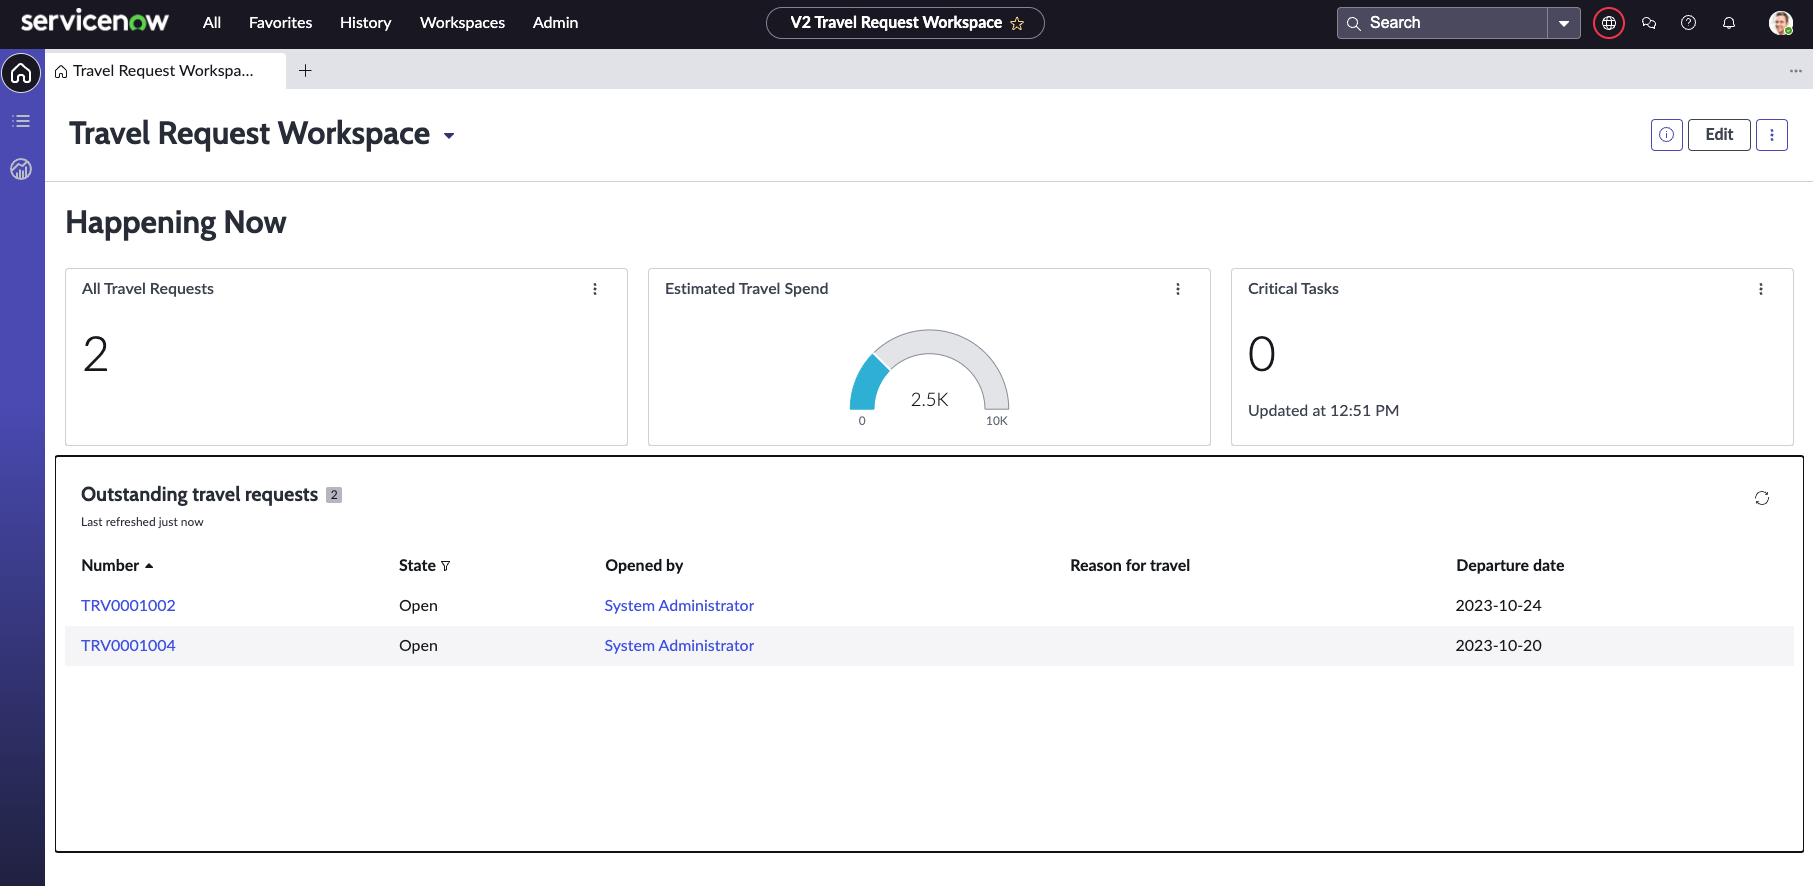
- We have left the final Critical Tasks widget for you to experiment with. Feel free to make any changes that you would like with the different Vizualizations available by repeating the steps in this exercise.
All widgets are also built with the drill-down capability. You can click on any of the widgets created to get to the underlying data supporting that widget.

Well done once again!
In this exercise, you have built a dashboard purely through drag and drop. This is obviously just a short snippet into the possibilities here, and there is so much more that can be done to give data-rich vizualizations to those who need easy access to data as fulfillers and admins, all in a single workspace.